Kekst CNC
COP 27 Report
Overview:
Analyzed over 2 million content pieces globally.
Derived insights from daily conversations and executive discussions on LinkedIn.
Enhanced understanding through data visualization and visual storytelling.
Overview:
Analyzed over 2 million content pieces globally.
Derived insights from daily conversations and executive discussions on LinkedIn.
Enhanced understanding through data visualization and visual storytelling.
The partnership:
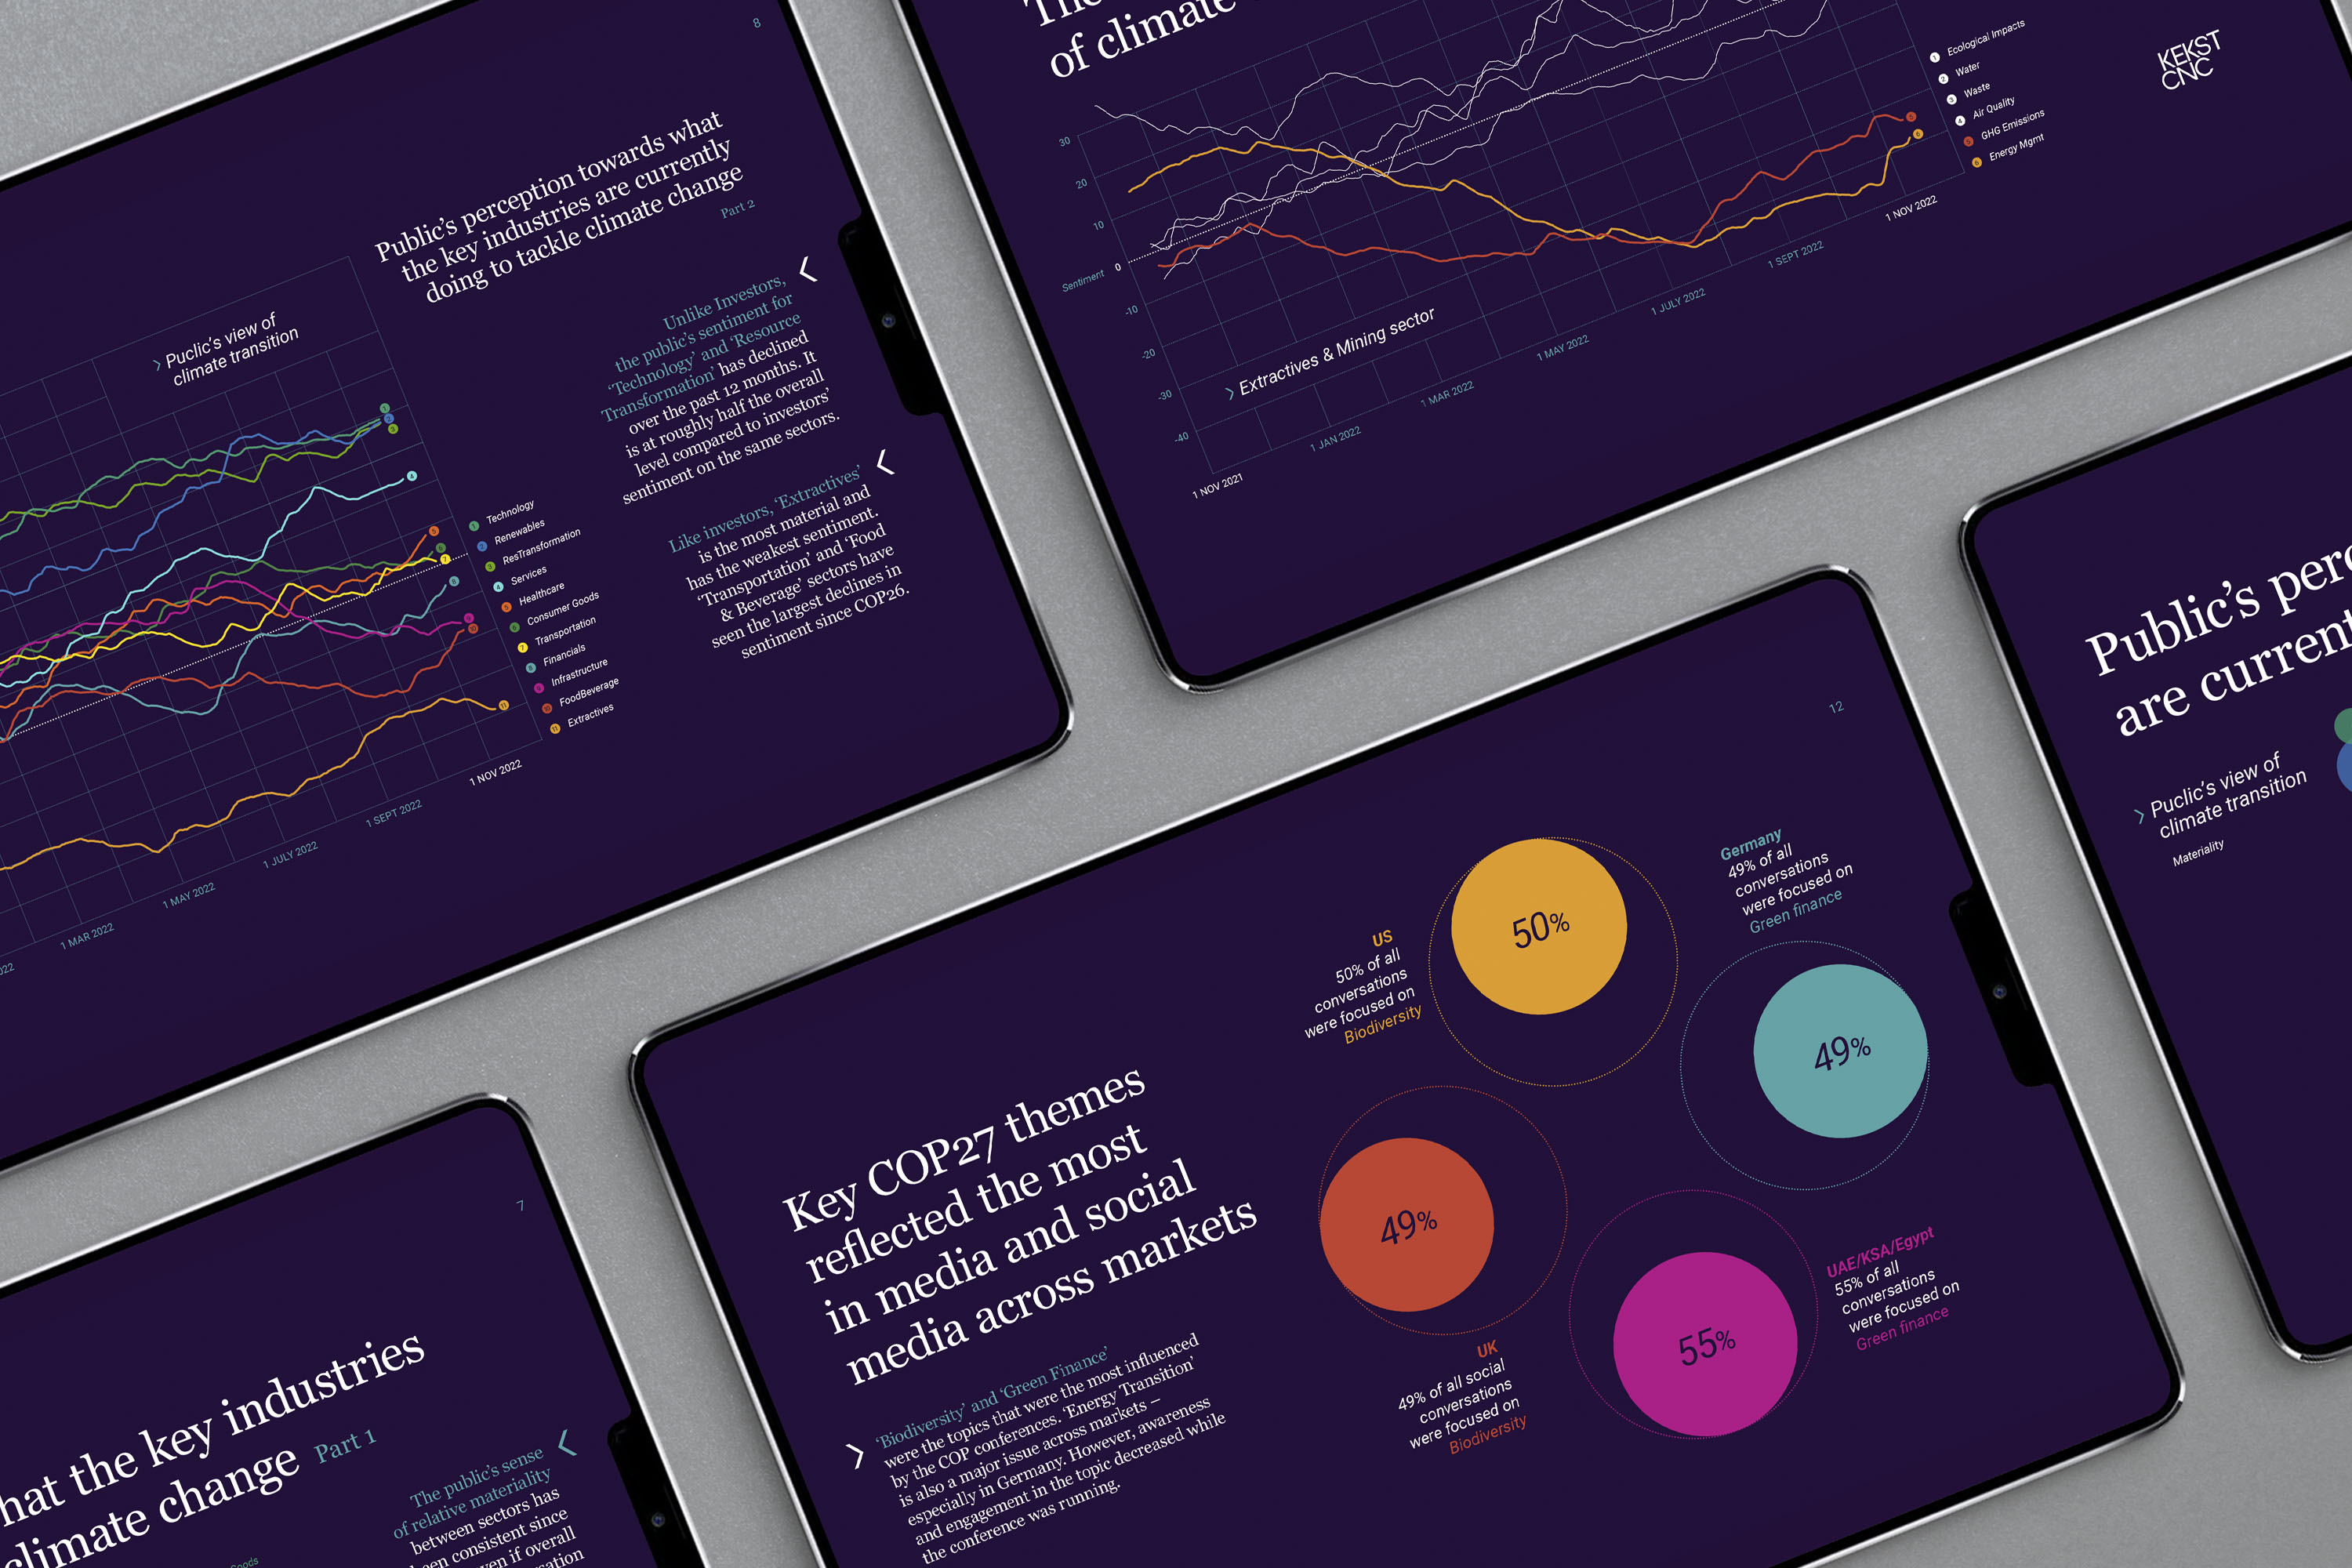
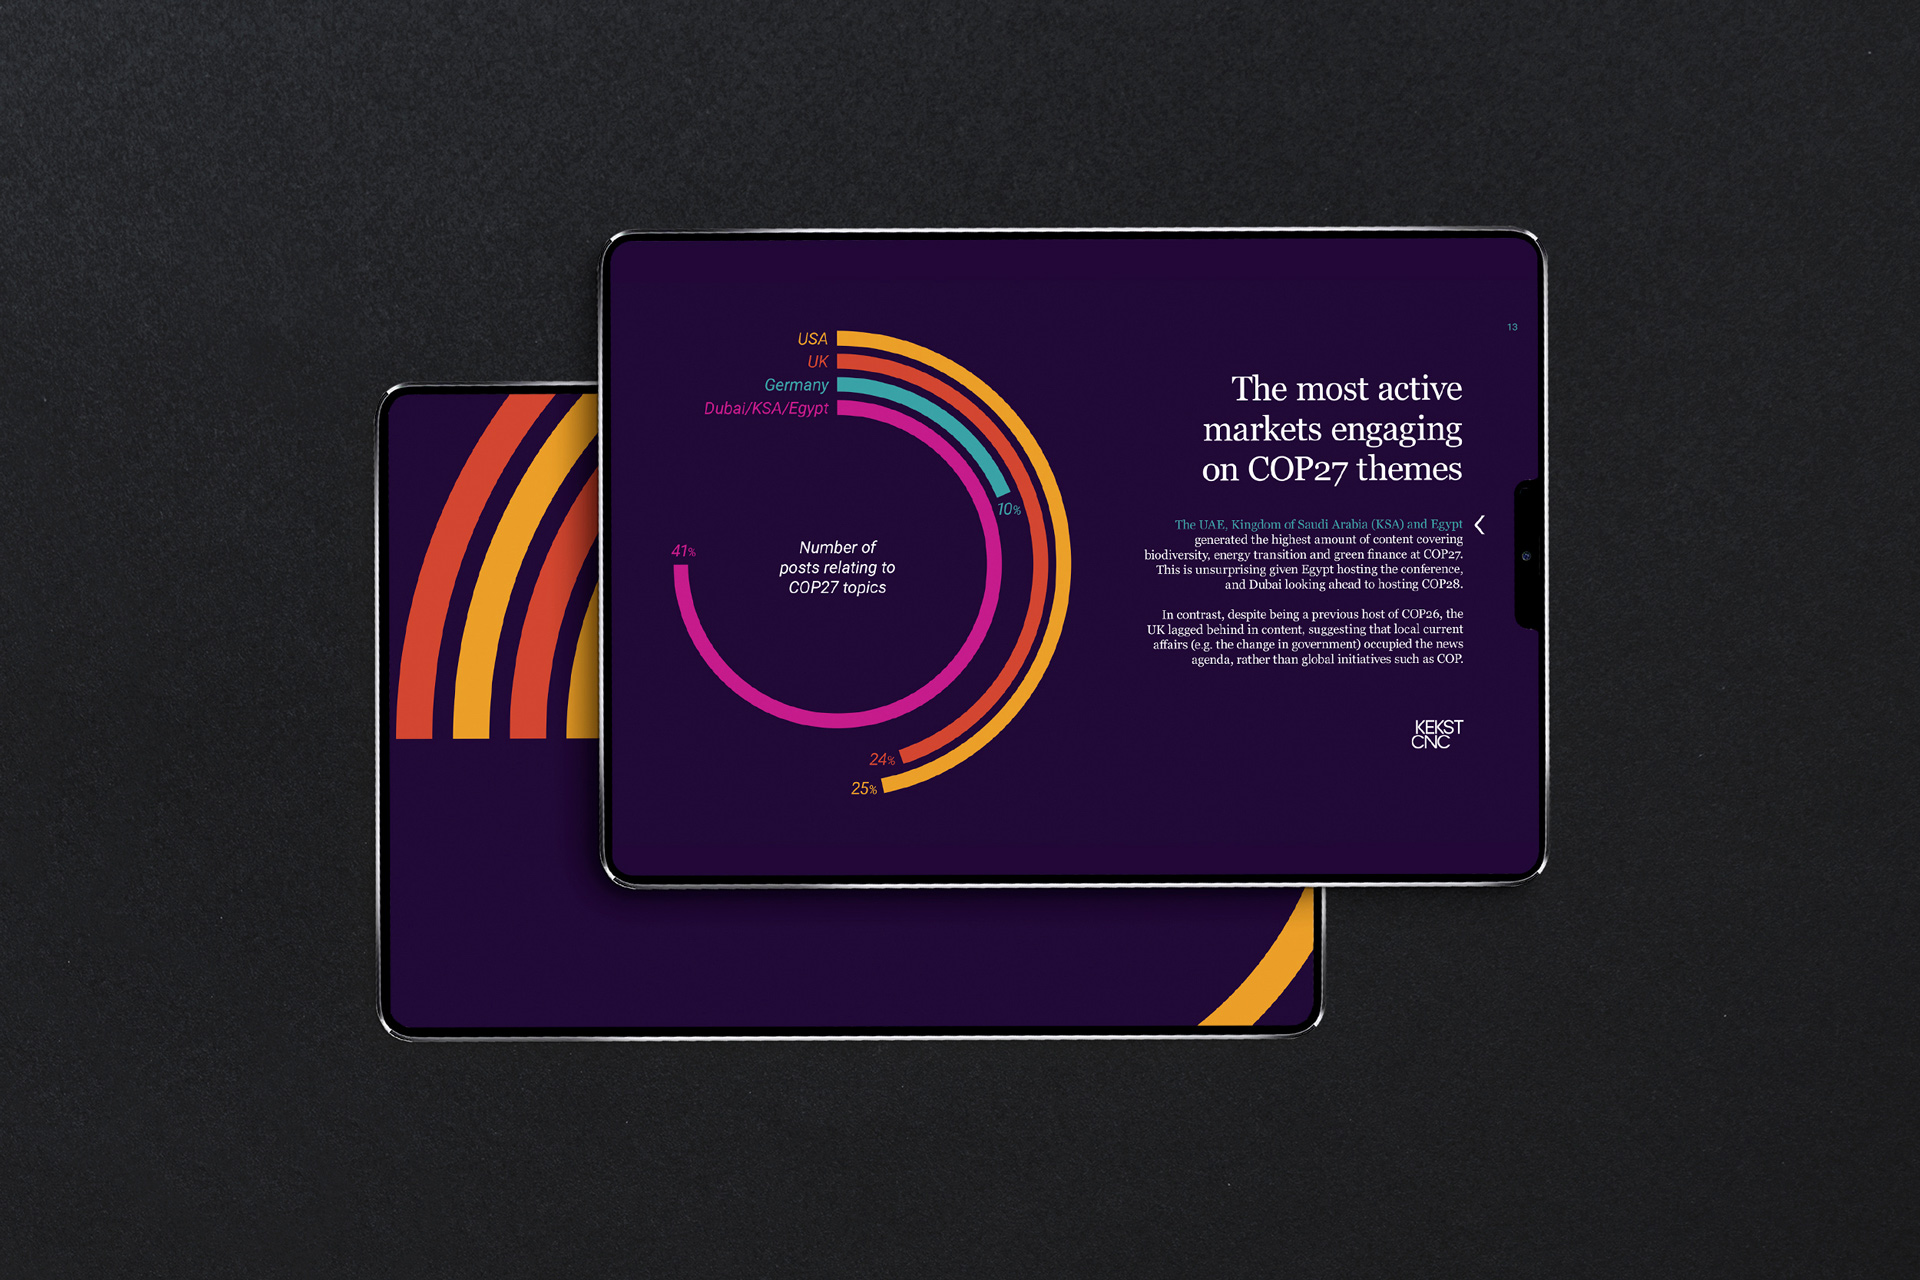
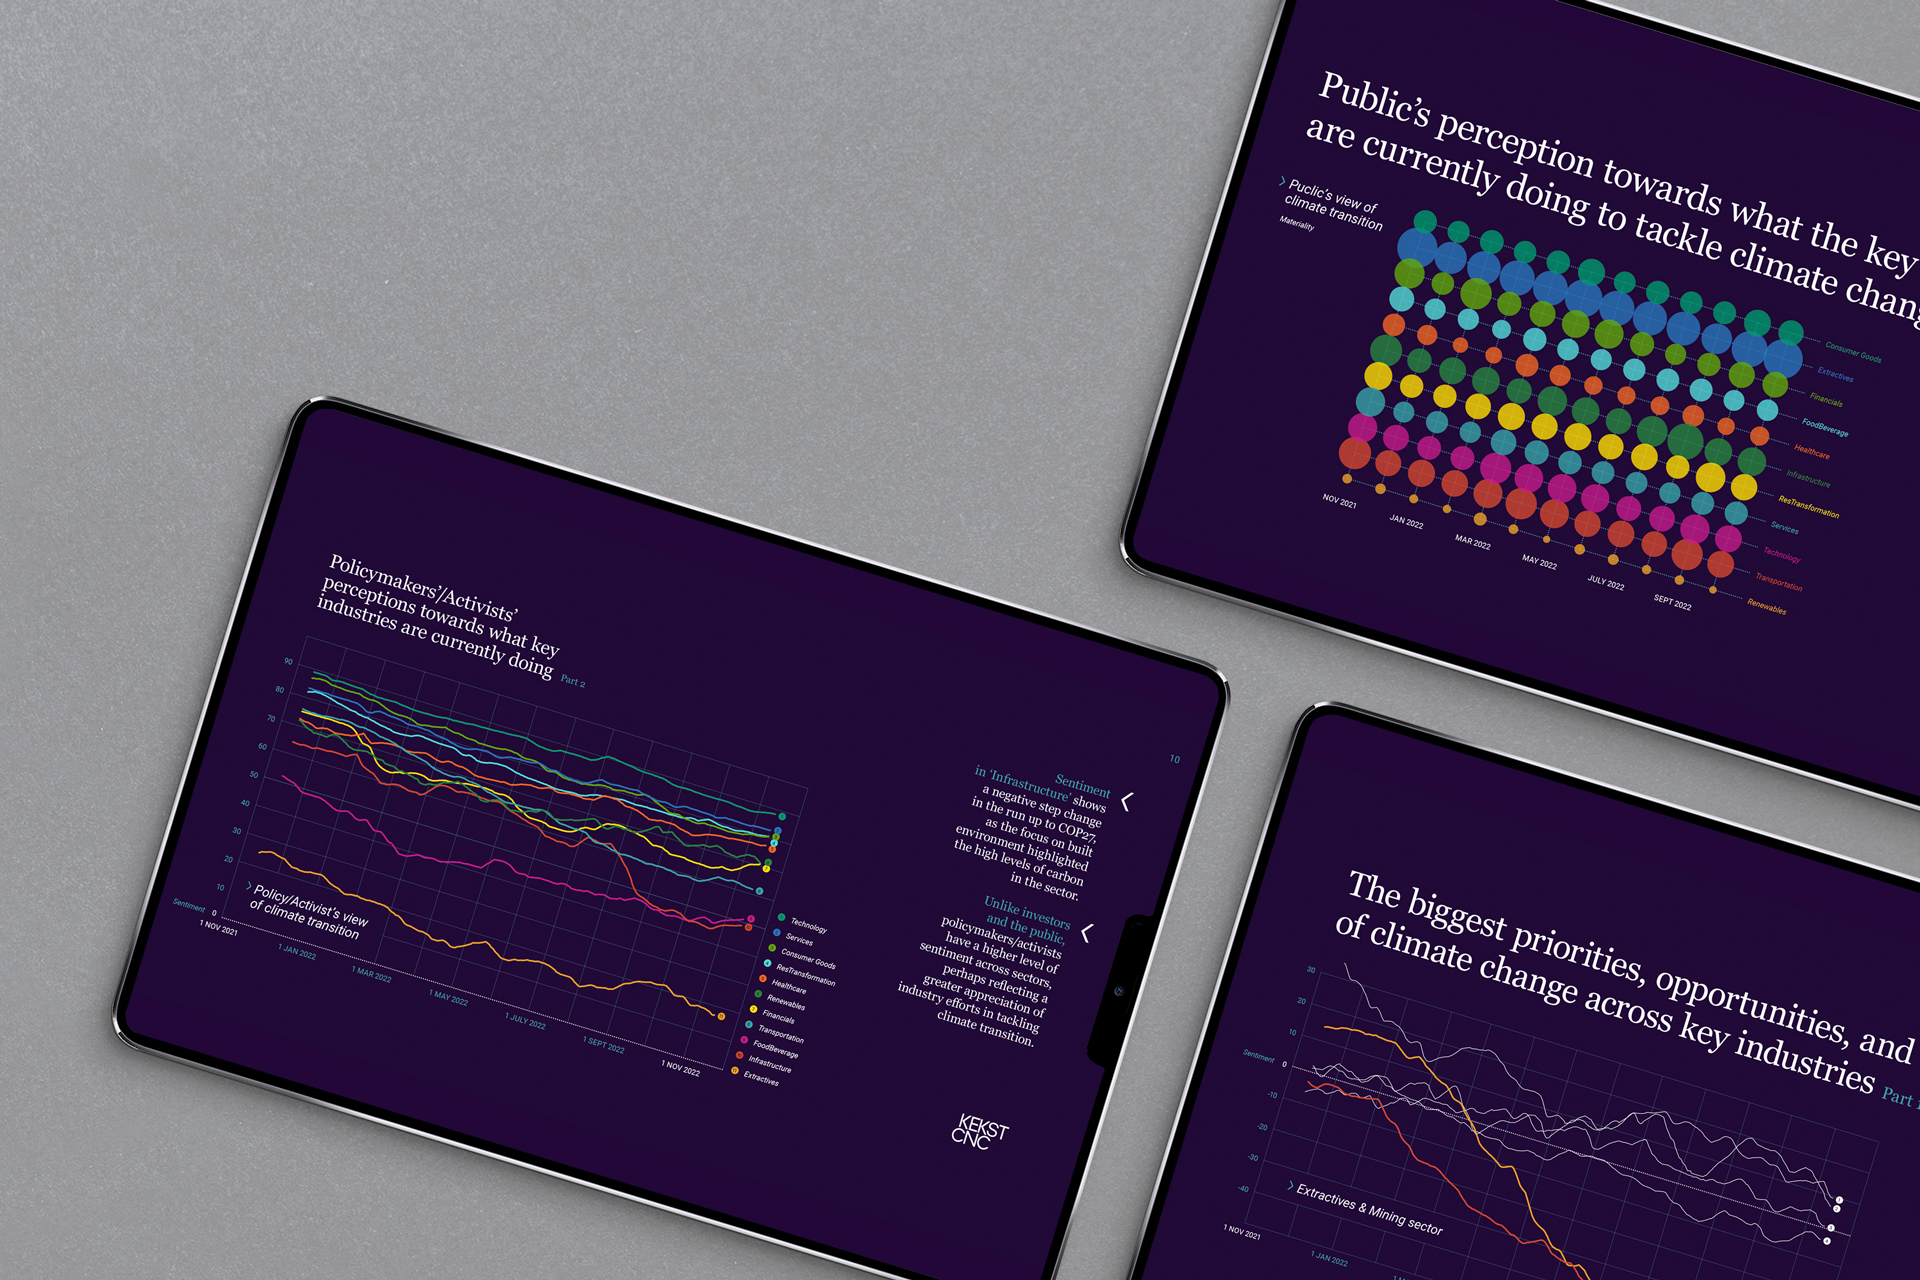
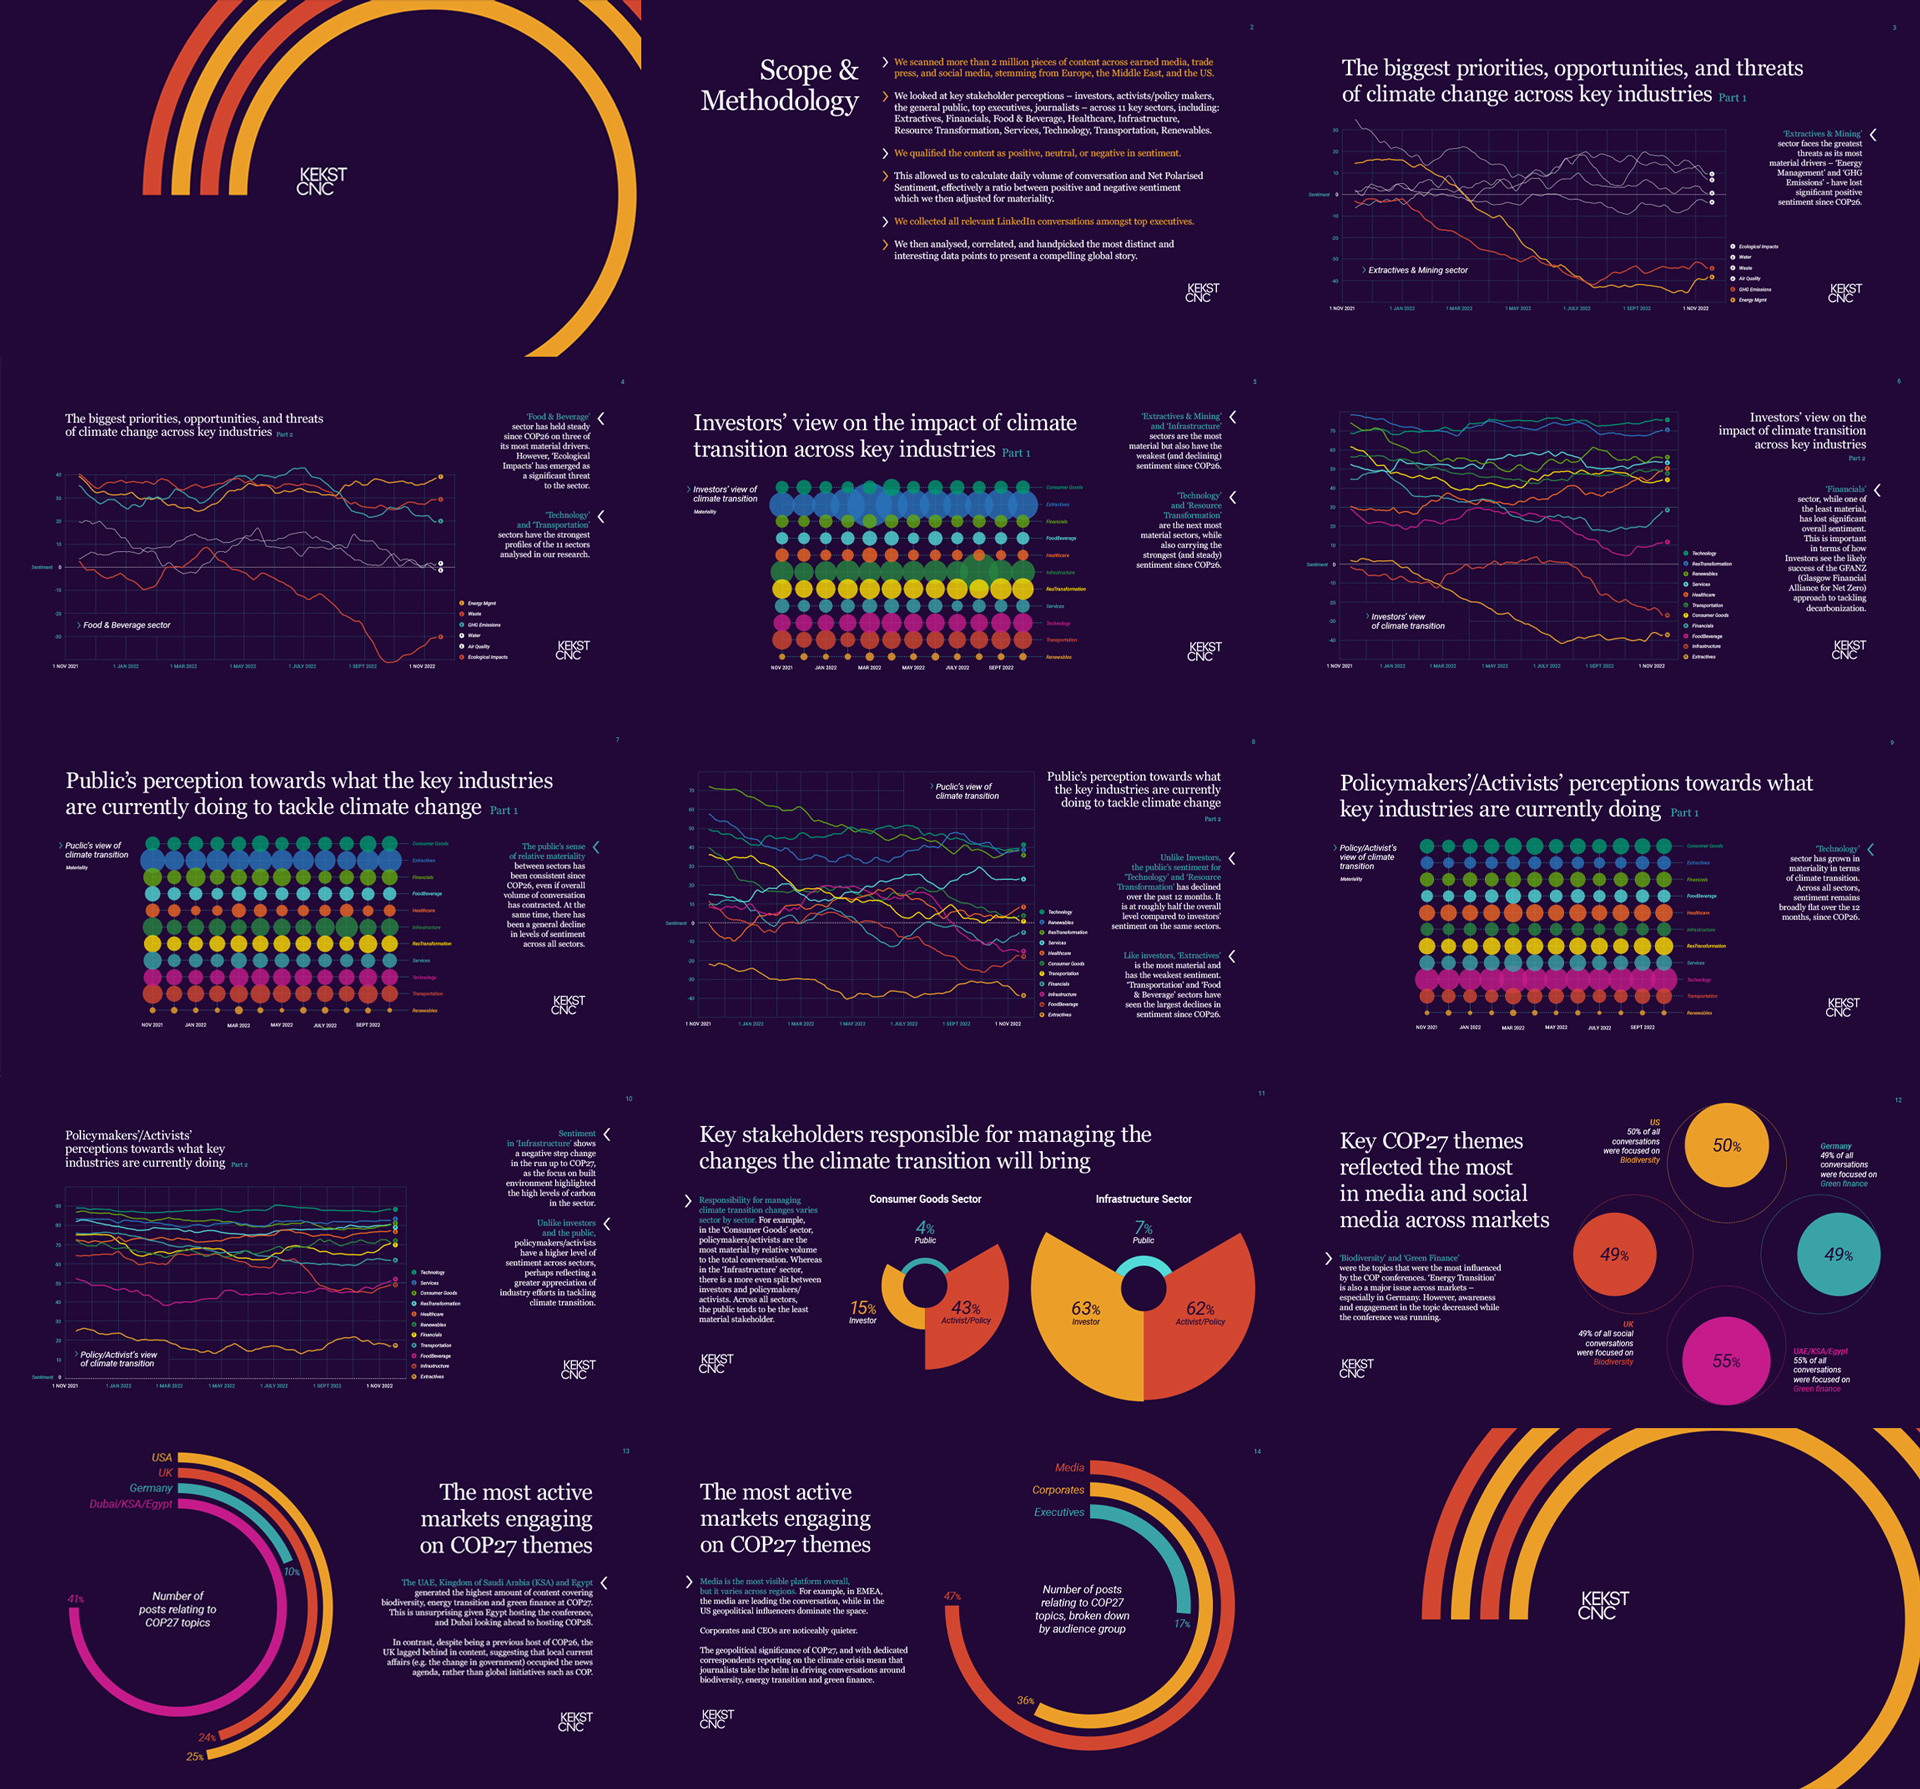
We launched a report for COP 27, grounded in an analysis of over 2 million content pieces from various regions and media sources. Our analysis included earned media, trade press, and social media content from Europe, the Middle East and the US.
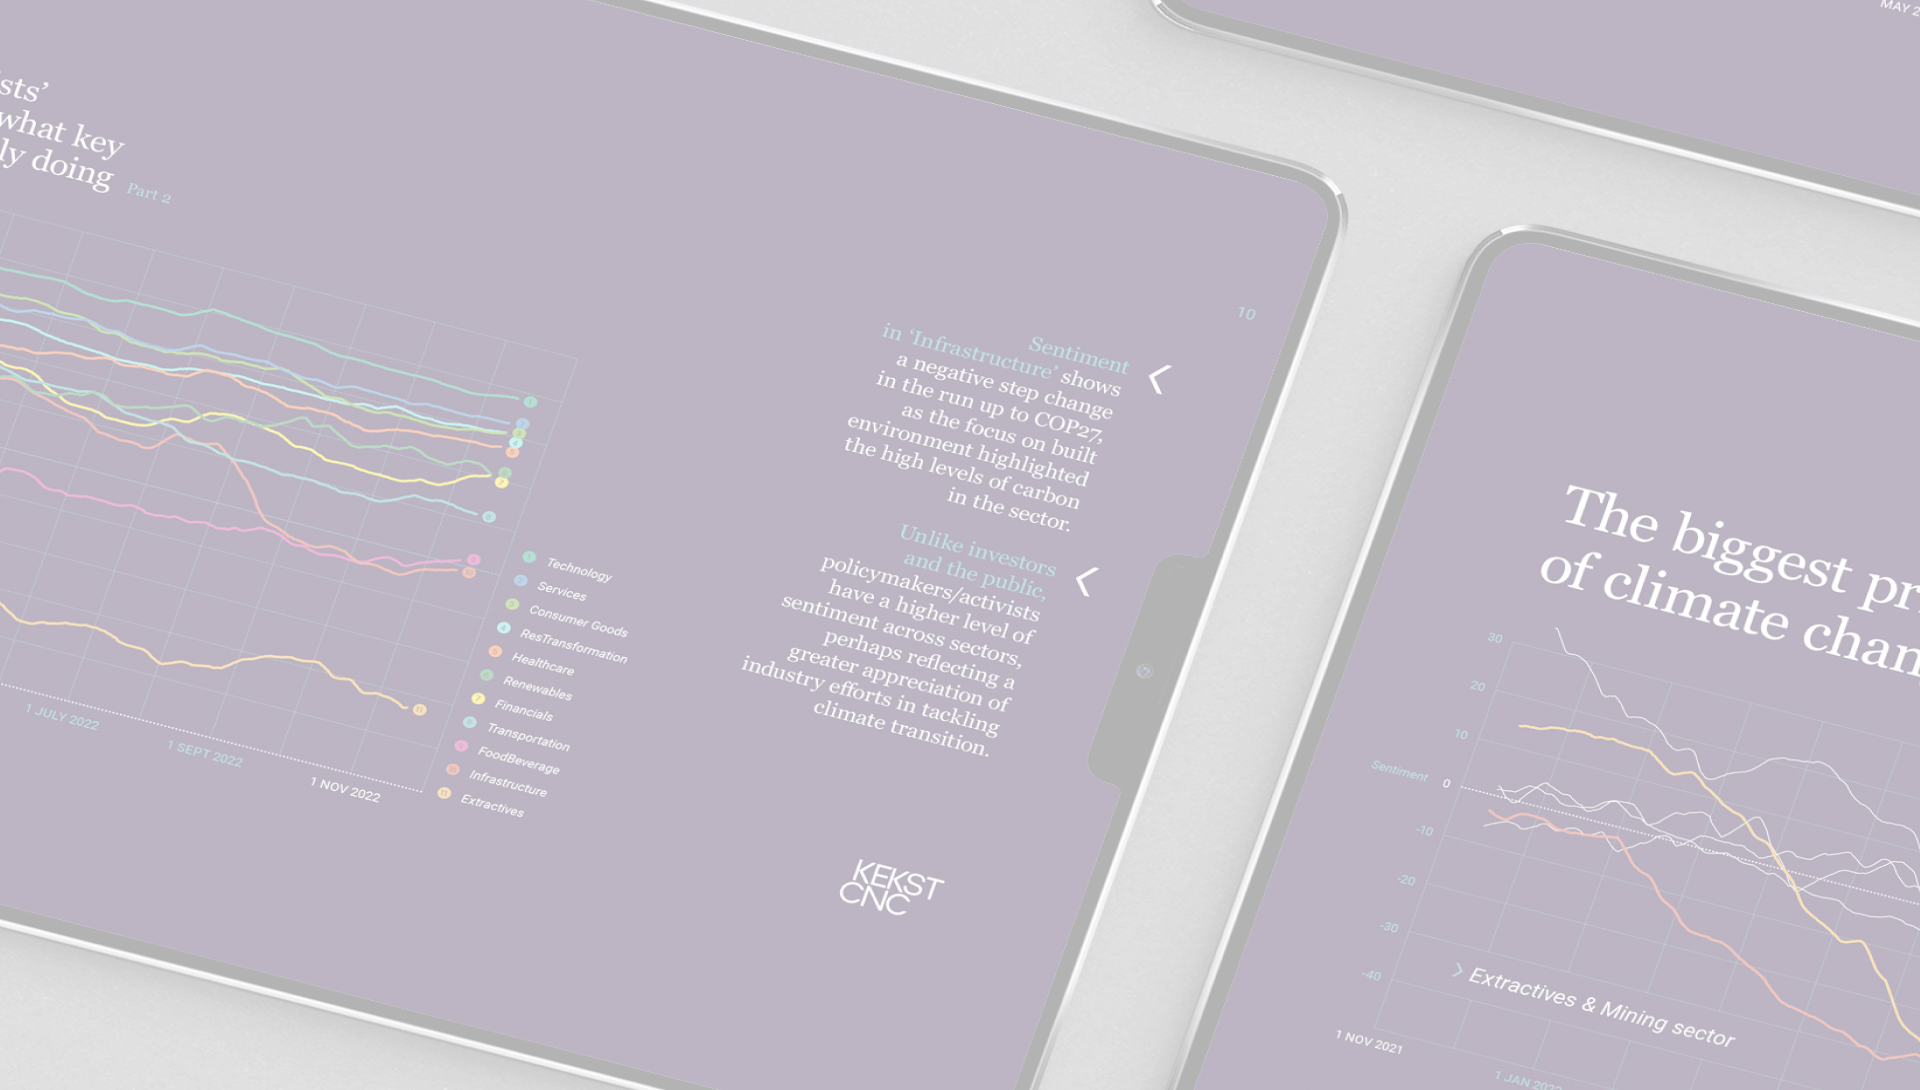
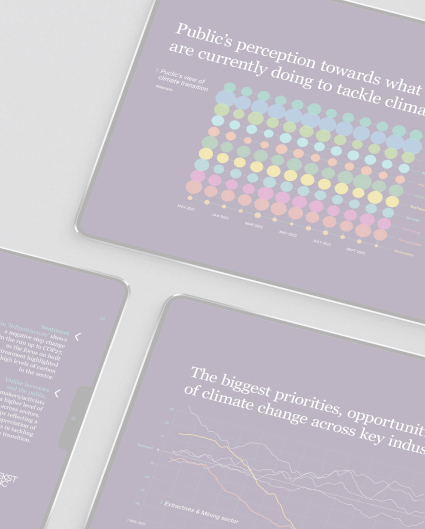
By analyzing and correlating the most distinct and interesting data points we crafted a compelling global narrative. Data visualization and visual storytelling in the report played a crucial role in enhancing understanding, discovering insights and informing decision-making.
We examined key stakeholder perceptions—investors, activists/policy makers, the general public, top executives and journalists, across 11 key sectors; extractives, financials, food and beverage, healthcare, infrastructure, resource transformation, services, technology, transportation and renewables. We categorized content sentiment as positive, neutral or negative.
This approach enabled us to calculate daily conversation volumes and net polarized sentiment; a ratio of positive to negative sentiment adjusted for materiality. Insights were further enriched by LinkedIn conversations among top executives.